
Google Workspace Marketplace


Dashboards AI - Untitled88™
AI-powered Dashboard creation for Google Sheets™
דף האפליקציה עודכן בתאריך:14 במאי 2026
האפליקציה פועלת עם:
+2K



סקירה כללית
Untitled88™ for Google Sheets™ lets you generate AI-powered dashboards from your spreadsheet data using natural language prompts.

Untitled88™ connects directly to your active Google Sheets™ file and allows you to analyze your data through a built-in chat interface. Instead of manually creating pivot tables, charts, and calculated fields, you can describe what you want to see - and Untitled88 generates a structured, analysis-ready dashboard based on your sheet’s data.

How it works:

• Open the Untitled88™ extension inside Google Sheets™
• Use the chat panel to describe the analysis or dashboard you want
• The extension reads your current Google Sheets™ data
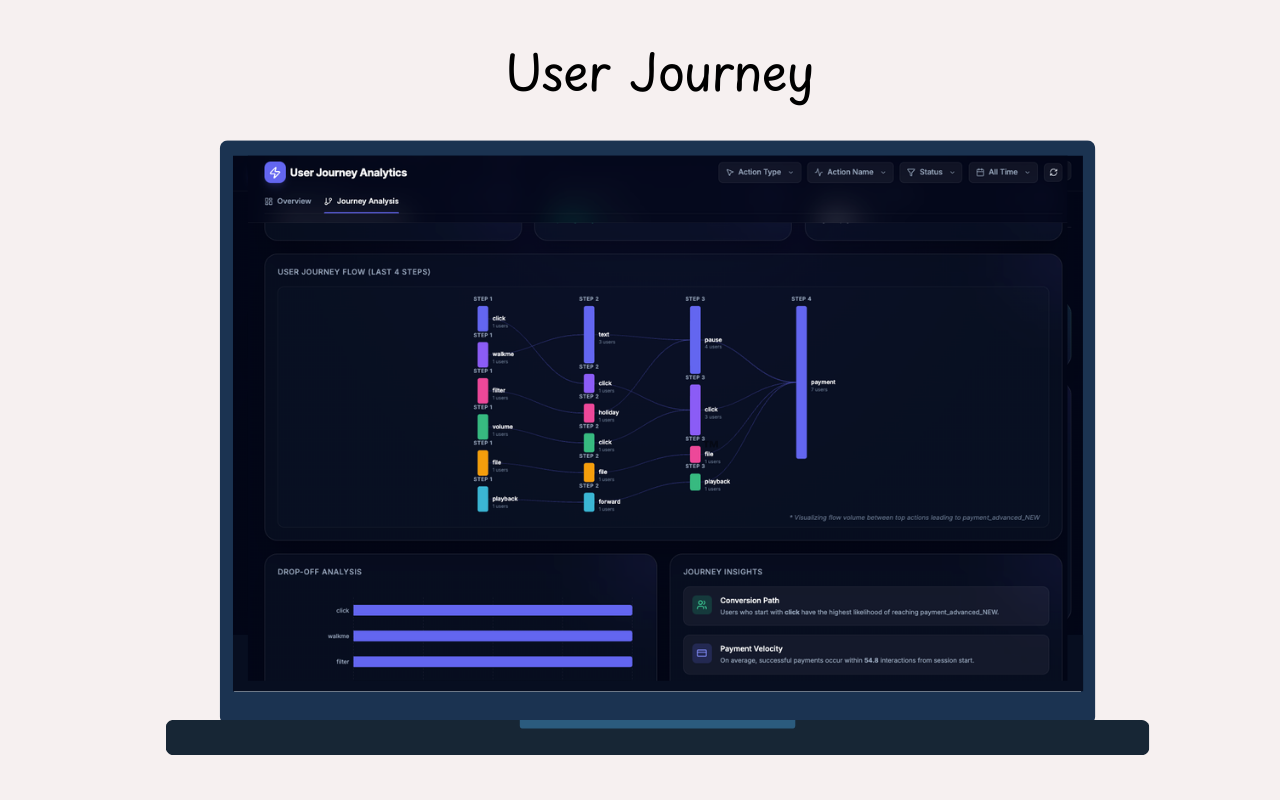
• A complete dashboard is generated and published to your Untitled88™ workspace

The generated dashboard is available on untitled88.com, where you can:

• Modify visualizations using additional natural language prompts
• Add or adjust charts and breakdowns
• Explore trends, comparisons, and segments
• Update the dashboard when your data changes

The extension does not import data from external systems. It analyzes only the data available in the active Google Sheets™ file selected by the user.

Untitled88™ is designed for analysts, business users, and teams who want to move from spreadsheet data to structured dashboards without manual dashboard building.
מידע נוסף
sell
תמחורבחינם
code
מפתח
לא עסק
email
lock
מדיניות הפרטיות
description
תנאים והגבלות
flag
דיווחסימון כבלתי הולמת






חיפוש
ניקוי החיפוש
סגירת החיפוש
אפליקציות Google
התפריט הראשי