Google Workspace Marketplace

everviz
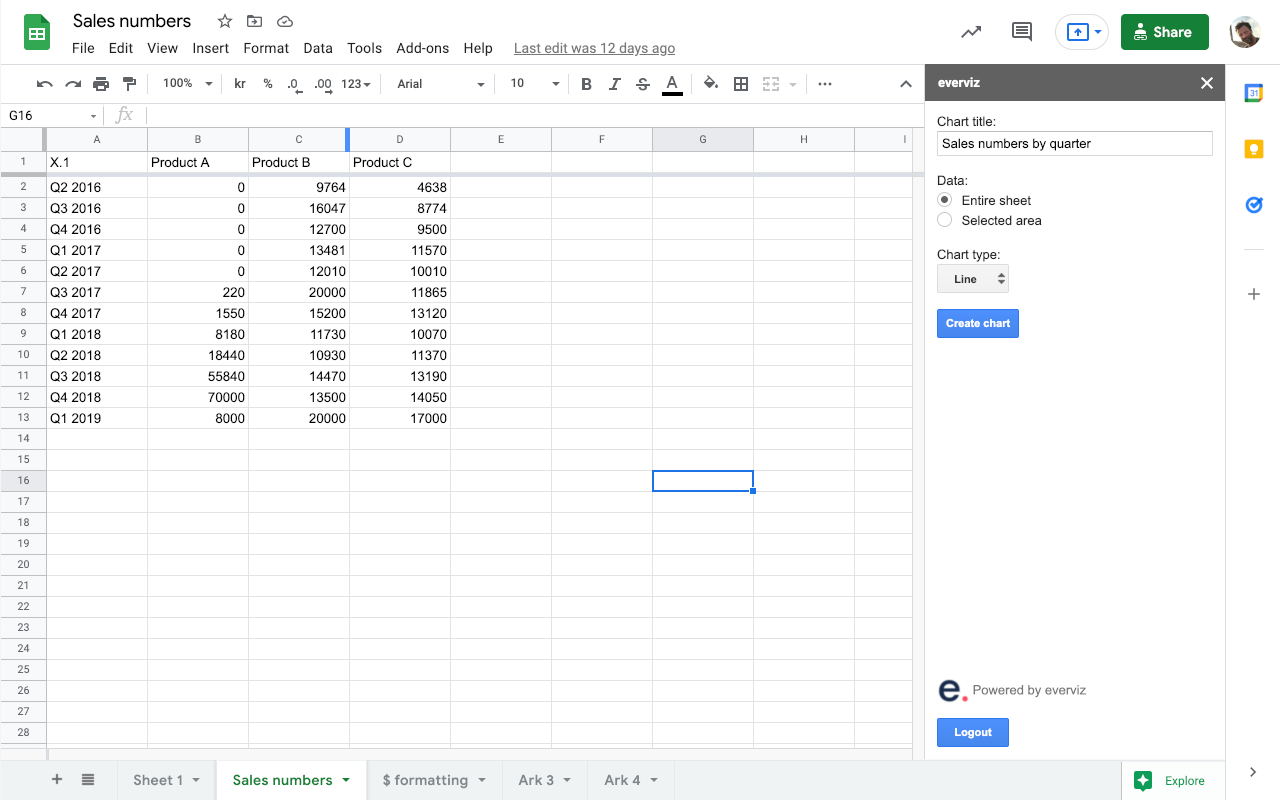
Create attractive, interactive charts directly from your spreadsheet data.
정보 업데이트:2024년 10월 9일
호환 기기:
5천+


개요
Create interactive charts directly in Google Sheets

Whether you are a journalist, researcher or business executive, sharing your data through attractive, interactive charts is now simpler than ever. With everviz for Google Sheets, you can easily create charts directly from your spreadsheets.

everviz empowers journalists and publishers with a tool to enrich stories with engaging interactive visualizations. Simple to use and no need for programming skills. Create brand consistent charts with cutting edge accessibility functions to reach out to a bigger audience.

Get started
The add-on requires an everviz account you can create immediately after the installation. Choose the data you want to include in your chart and click the “Create chart” button. This will create an interactive chart which you can customize with the power of everviz. Publish your chart and embed it to a website.

By installing the add-on, you agree to the everviz Privacy Policy https://app.everviz.com/privacy


Any question? Drop us a line at support@everviz.com
추가정보


검색
검색어 지우기
검색 닫기
Google 앱
기본 메뉴