Google Workspace Marketplace
ExtraChart
Advanced chart maker for Google Slides™. 20 chart types, customizable design, built-in data editor, real-time preview.
Fortegnelse opdateret:28. januar 2026
Fungerer sammen med:
Ingen anmeldelser
136


Oversigt
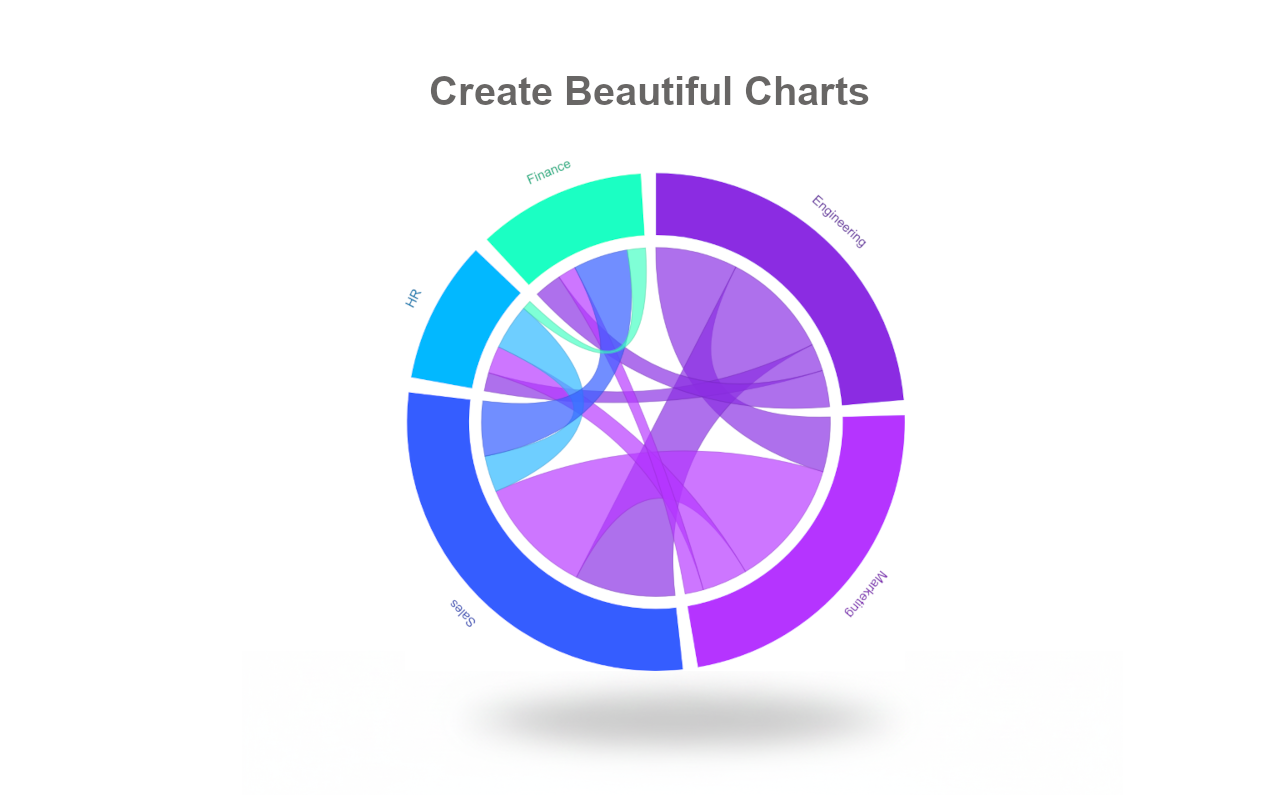
Transform Google Slides™ into a powerful chart maker. Create bar charts, pie charts, funnel charts, radar charts, heatmaps, and 15+ advanced graph types—all without leaving your presentation. No Google Sheets™ required.

🎯 Professional Data Visualization for Google Slides™

ExtraChart brings advanced charting capabilities directly into Google Slides™. Whether you need a simple bar chart, a detailed funnel chart for sales, or a complex box plot for research, ExtraChart delivers publication-quality results in seconds.

📊 20 Chart Types

Bar & Column Charts → Bar Chart, Stacked Bar Chart, Grouped Bar Chart, Horizontal Bar Chart

Line & Area Charts → Line Chart, Multi-Line Chart, Curved Line Chart, Stepped Line Chart, Area Chart

Pie & Donut Charts → Pie Chart, Half Pie Chart, Donut Chart

Business & Analytics Charts → Funnel Chart (conversion tracking), Scatter Plot (correlation analysis), Heat Map (data density), Bullet Chart (KPI tracking), Box Plot (statistical distribution)

Advanced Visualization → Radar Chart / Spider Chart (multi-dimensional comparison), Stream Graph (flow over time), Chord Diagram (relationships)

🎨 Customization Beyond Google Slides™ Defaults

Typography: Choose from professional fonts including Roboto and Inter
Color Palettes: Create unlimited custom color schemes for brand consistency
Axes & Labels: Full control over tick marks, gridlines, scales, and formatting
Layout: Adjust padding, margins, borders, and spacing with precision
Live Preview: See changes instantly before inserting into slides

⚡ Built-In Data Editor (No Google Sheets™ Needed)

Paste data directly from Excel, CSV, or Google Sheets™
Edit data in an integrated lightweight spreadsheet interface
Changes update your chart preview in real-time
Save charts to your private workspace for future editing

💼 Perfect For:

✓ Sales & Marketing → Funnel charts, conversion reports, performance dashboards
✓ Business Intelligence → KPI tracking, executive summaries, quarterly reviews
✓ Academic & Research → Statistical charts (box plots), data analysis, publications
✓ Consulting & Client Presentations → Professional-grade visualizations

🆓 Free Plan

10 charts per month
4 essential chart types: Bar, Stacked Bar, Line, Pie
Try before upgrading

⭐ Pro Plan

Unlimited chart creation
All 20 chart types including Funnel, Radar, Heat Map, Box Plot
No watermarks
High-resolution charts images with transparent backgrounds
Priority support

🔒 Privacy-First Architecture

100% client-side rendering
Zero access to your Google Drive™ files
GDPR compliant
Data used only for chart generation

----

🆕 What's New

Enhanced User Experience:
- Simplified onboarding for new users
- Improved typography and visual hierarchy
- Clearer edit/create flow with inline instructions
- Smoother loading states

----

Google Slides™, Google Sheets™, Google Drive™, and Google Workspace™ are trademarks of Google LLC.
Yderligere oplysninger
sell
PrisUden beregning med betalingsfunktioner
code
Udvikler
email
lock
Privatlivspolitik
description
Servicevilkår
flag
RapportRapportér som upassende


Søgning
Ryd søgning
Luk søgning
Google-apps
Hovedmenu