Google Workspace Marketplace
ExtraChart
Advanced chart maker for Google Slides™. 20 chart types, customizable design, built-in data editor, real-time preview.
Sahibi:
Listelemenin güncellendiği tarih:28 Ocak 2026
Şununla çalışır:
Yorum yok
136


Genel Bakış
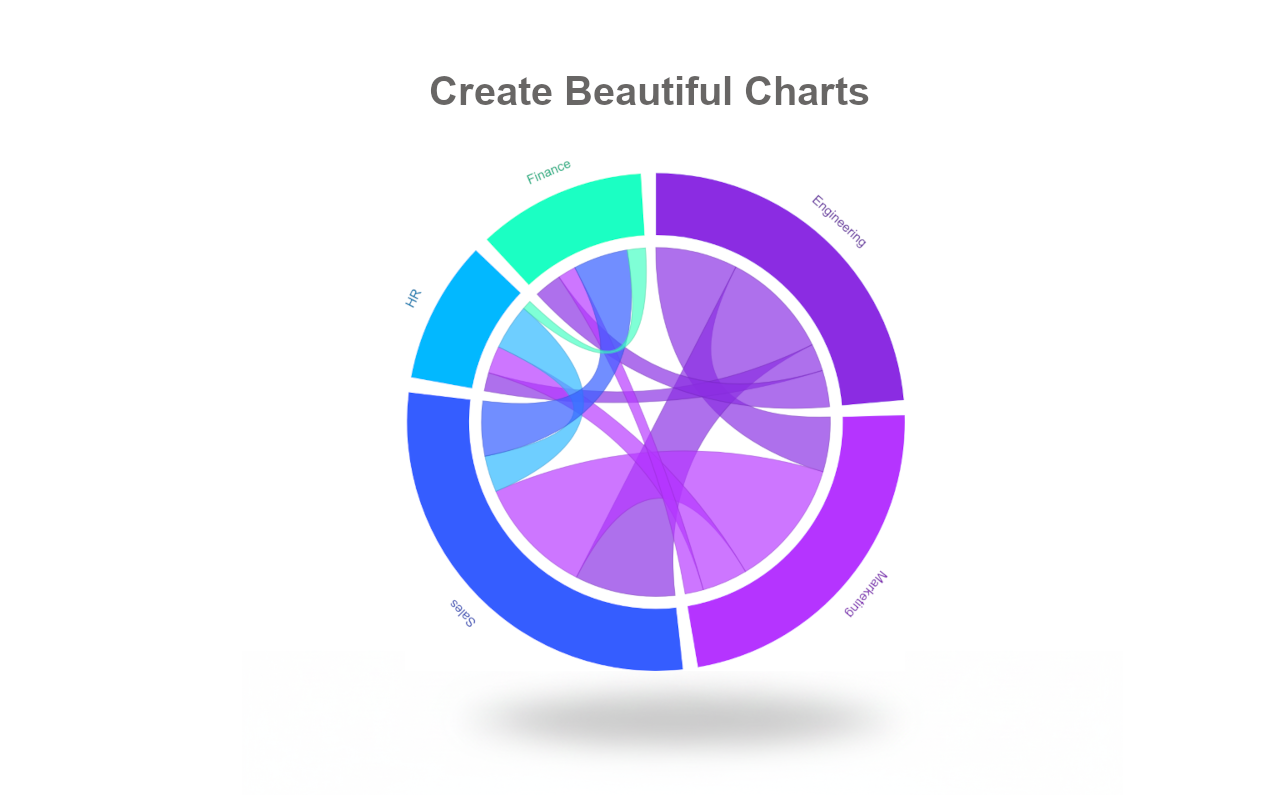
Transform Google Slides™ into a powerful chart maker. Create bar charts, pie charts, funnel charts, radar charts, heatmaps, and 15+ advanced graph types—all without leaving your presentation. No Google Sheets™ required.

🎯 Professional Data Visualization for Google Slides™

ExtraChart brings advanced charting capabilities directly into Google Slides™. Whether you need a simple bar chart, a detailed funnel chart for sales, or a complex box plot for research, ExtraChart delivers publication-quality results in seconds.

📊 20 Chart Types

Bar & Column Charts → Bar Chart, Stacked Bar Chart, Grouped Bar Chart, Horizontal Bar Chart

Line & Area Charts → Line Chart, Multi-Line Chart, Curved Line Chart, Stepped Line Chart, Area Chart

Pie & Donut Charts → Pie Chart, Half Pie Chart, Donut Chart

Business & Analytics Charts → Funnel Chart (conversion tracking), Scatter Plot (correlation analysis), Heat Map (data density), Bullet Chart (KPI tracking), Box Plot (statistical distribution)

Advanced Visualization → Radar Chart / Spider Chart (multi-dimensional comparison), Stream Graph (flow over time), Chord Diagram (relationships)

🎨 Customization Beyond Google Slides™ Defaults

Typography: Choose from professional fonts including Roboto and Inter
Color Palettes: Create unlimited custom color schemes for brand consistency
Axes & Labels: Full control over tick marks, gridlines, scales, and formatting
Layout: Adjust padding, margins, borders, and spacing with precision
Live Preview: See changes instantly before inserting into slides

⚡ Built-In Data Editor (No Google Sheets™ Needed)

Paste data directly from Excel, CSV, or Google Sheets™
Edit data in an integrated lightweight spreadsheet interface
Changes update your chart preview in real-time
Save charts to your private workspace for future editing

💼 Perfect For:

✓ Sales & Marketing → Funnel charts, conversion reports, performance dashboards
✓ Business Intelligence → KPI tracking, executive summaries, quarterly reviews
✓ Academic & Research → Statistical charts (box plots), data analysis, publications
✓ Consulting & Client Presentations → Professional-grade visualizations

🆓 Free Plan

10 charts per month
4 essential chart types: Bar, Stacked Bar, Line, Pie
Try before upgrading

⭐ Pro Plan

Unlimited chart creation
All 20 chart types including Funnel, Radar, Heat Map, Box Plot
No watermarks
High-resolution charts images with transparent backgrounds
Priority support

🔒 Privacy-First Architecture

100% client-side rendering
Zero access to your Google Drive™ files
GDPR compliant
Data used only for chart generation

----

🆕 What's New

Enhanced User Experience:
- Simplified onboarding for new users
- Improved typography and visual hierarchy
- Clearer edit/create flow with inline instructions
- Smoother loading states

----

Google Slides™, Google Sheets™, Google Drive™, and Google Workspace™ are trademarks of Google LLC.
Ek bilgi
sell
FiyatlandırmaÜcretsiz (Ücretli özellikler vardır)
code
Geliştirici
email
lock
Gizlilik politikası
description
Hizmet şartları
flag
BildirUygunsuz olarak işaretle


Arama
Aramayı temizle
Aramayı kapat
Google uygulamaları
Ana menü