MapChart for Google Sheets™
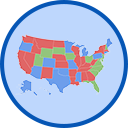
Create a custom map from your Sheets data. MapChart for Sheets™ helps you display your data on various maps including US states, world, or US counties for easy visualization.
Listingan diperbarui:13 Mei 2025
Berfungsi dengan:
87 rb+


Ringkasan
🗺️ Generate custom maps using your Google Sheets™ data.

In need of displaying your data geographically? Introducing MapChart:

1️⃣ Pick the desired map.
2️⃣ Choose the data fields.
3️⃣ Personalize your map's look.
4️⃣ View it alongside your sheet or download as PNG.

MapChart for Google Sheets™ enables you to uncover geographical trends within your data. Add it to your sheet and begin crafting your maps.

Leverage the MapChart add-on to:

💰 Monitor sales stats by state.
🌎 Showcase your company's global presence.
🗳️ Present election outcomes by county.
✈️ Craft a world map of countries visited.
🏢 Illustrate your organization's regional activities.
🔬 Plot survey or research data on a map.

MapChart helps you present your data visually, revealing hidden patterns and connections.

Premium features available with a one-time payment:

MapChart for Google Sheets™ is free. A one-time payment unlocks the Premium version, featuring:

🔥 4 additional maps:

🗺️ World map
🇺🇸 US counties map
🌎 US & Canada map
🌍 Europe map

🔥 Enhanced styling options:

🎨 Background color
🎨 Border color
🎨 Default color
🎨 Border width

The official Google Sheets™ add-on from the leading map-creation website. Create custom maps from your Google Sheets data swiftly and simply!

*Google Sheets™ is a trademark of Google LLC.
Informasi tambahan
sell
HargaTanpa biaya dengan fitur berbayar
code
Developer
email
Dukungan
lock
Kebijakan privasi
description
Persyaratan layanan
flag
LaporkanTandai sebagai tidak pantas
Telusuri
Hapus penelusuran
Tutup penelusuran
Aplikasi Google
Menu utama


