
Google Workspace Marketplace


SheetsFinance | Stock Market Analysis
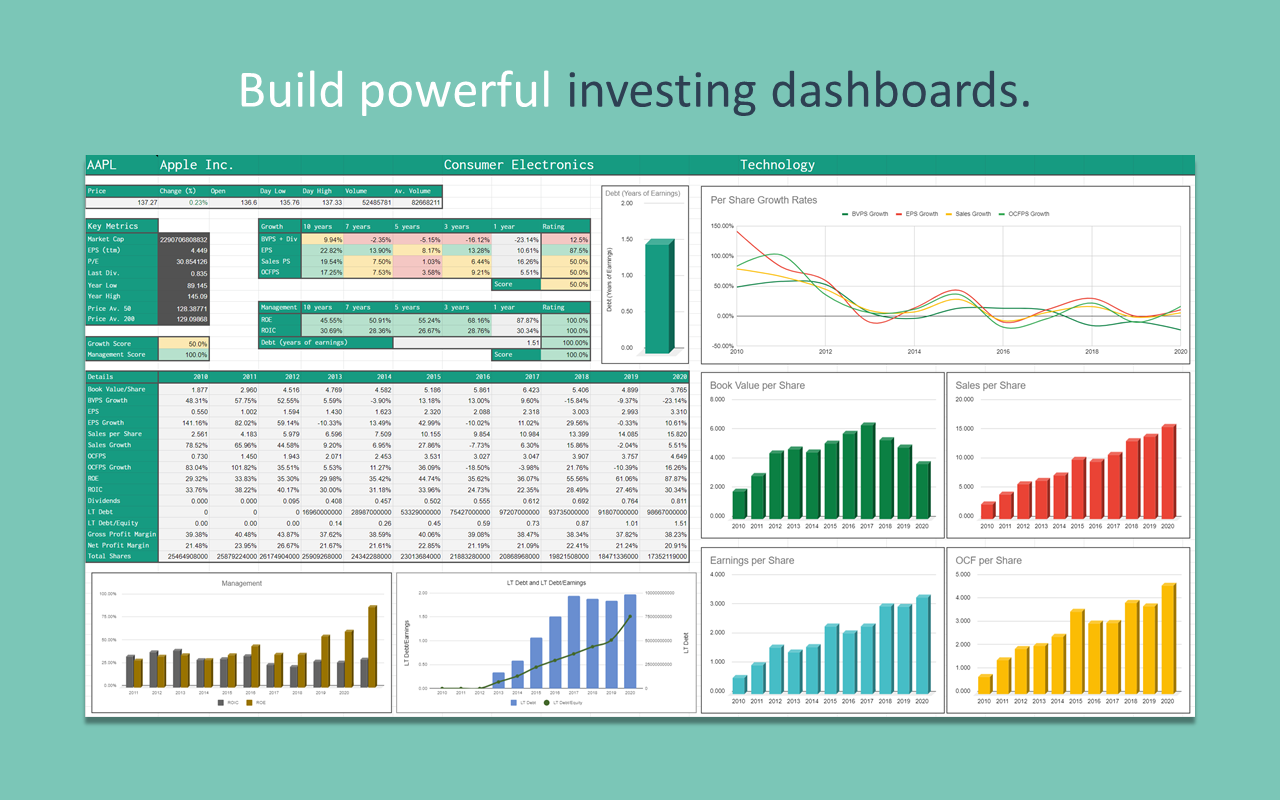
Global market data for 87,000+ symbols. Real-time prices to 30+ years of fundamentals. Stocks, ETFs, options, dividends, crypto, forex. Build investing dashboards, portfolio trackers, stock screeners.
बनाने वाली कंपनी:
लिस्टिंग को पिछली बार अपडेट किया गया:2 अक्टूबर 2026
इनके साथ काम करता है:
63 हज़ार+



अवलोकन
SheetsFinance delivers global market data directly into Google Sheets™ through a comprehensive library of custom functions. Access 87,000+ stocks, ETFs, mutual funds, cryptocurrencies, forex pairs, bonds, commodities and indices across 66+ exchanges, with 30+ years of historical prices and financial statements, professional options data, screening and connected brokerage holdings. Built for individual investors, analysts and financial professionals who need reliable data to power their models, dashboards and portfolio tracking.
🚀 Try it free for 15 days with full access to all features. No payment details required.
📈 WHAT YOU CAN DO
➤ Track portfolios with prices across 80,000+ stocks, ETFs, mutual funds, crypto, forex, bonds, commodities and indices on 66+ global markets, with real-time quotes on select markets
➤ Go beyond the data available in Google Finance™ with deeper fundamentals, longer history, options, screening and global coverage
➤ Analyse companies with 30+ years of annual and quarterly financial statements, 100+ ratios, growth metrics and company KPIs
➤ Screen the full database by fundamental and market filters to find new ideas
➤ Connect unlimited accounts across 30+ brokers and sync your current holdings, balances and transactions into one sheet
➤ Pull data for up to 5,000 symbols in a single batch function call
🧰 BUILT-IN TOOLS
✔ Function Generator: build any SheetsFinance function by picking options from menus, no formula knowledge needed
✔ Stock Screener: filter the full database from the sidebar, or use SF_SCREEN() to keep results live in your sheet
✔ Symbol Search: find tickers across all supported exchanges, with exchange filtering
✔ Template Library: free pre-built dashboards and models you can copy and customise
✔ Code Guide: in-app reference for every function and data type
📊 DATA COVERAGE
✔ Prices and time series: price quotes (real-time on select markets), pre/post-market data, daily and intraday history (down to 1-minute) for 30+ years, adjusted and dividend-adjusted OHLCV, VWAP, split history, sparklines and price change from 1D to 10Y
✔ Fundamentals: income statement, balance sheet and cash flow (annual, quarterly and TTM), 100+ financial ratios, growth data, company KPIs, revenue by product and geography, earnings and analyst estimates, Altman Z-Score, Piotroski Score, ESG scores and dividend history
✔ Research: analyst ratings, consensus and price targets, insider transactions and statistics, institutional holders, historical sector and industry PE, and real-time news feeds
✔ ETFs: fund details (NAV, AUM, expense ratio), holdings, and sector and country exposure
✔ Options: professional OPRA data with full chains, individual contracts, expirations, IV analytics, volatility surfaces and 20+ years of history including expired contracts
✔ Brokerage: connect unlimited accounts across 30+ supported brokers, including Schwab, Fidelity, Interactive Brokers, Robinhood, E*Trade, Vanguard US, Questrade, Wealthsimple, DEGIRO, Trading212, CommSec and Coinbase. Sync your current holdings, balances, recent orders, options positions and transaction history into your sheet with SF_BROKERAGE(). Connections are read-only, so no trades can be placed.
✔ Technical analysis: SMA, EMA, WMA, DEMA, TEMA, RSI, ADX, Williams %R and standard deviation, from daily down to 1-minute intervals
✔ Calendars: earnings, dividends, splits, IPOs, financial statement releases and macroeconomic events
✔ Utilities: ISIN, CIK and CUSIP to ticker mapping, currency conversion and output scaling (K, M, B)
🌍 MARKETS
NYSE, NASDAQ, AMEX, TSX, LSE, Euronext, XETRA, SIX, OSE, ASX, HKEX, NSE, BSE, Shanghai, Shenzhen, Saudi Exchange, Nasdaq Copenhagen, plus crypto, forex, commodities and more.
🧮 EXAMPLES
Prices and time series
➤ Latest price: =SF("AAPL")
➤ Latest prices for 2,000 symbols: =SF(A1:A2000)
➤ FOREX rate: =SF("USDGBP")
➤ Full Quote: =SF("AAPL", "quote", "all")
➤ Pre/post-market data: =SF("AAPL", "prePostMarket")
➤ Closing price on a date: =SF("AAPL", "historical", "close", "2025-04-25")
➤ Price change across periods: =SF("AAPL", "change")
➤ Daily price history since 2015: =SF_TIMESERIES("AAPL", "2015-01-01", TODAY())
➤ Intraday 1-minute history: =SF_TIMESERIES("AAPL", "2026-03-02", "2026-03-04", "1min")
Fundamentals
➤ Full profile: =SF("AAPL", "profile")
➤ Profiles 2,000 symbols: =SF(A1:A2000, "profile")
➤ Annual income statements, 2015 to 2025: =SF("AAPL", "income", "all", "2015-2025")
➤ Quarterly income statements, 2015 to 2025: =SF("AAPL", "incomeQ", "all", "2015-2025")
➤ Q4 balance sheet for 2024: =SF("AAPL", "balanceQ4", "all", "2024")
➤ Annual revenue in AUD, scaled to millions: =SF("AAPL", "income", "revenue", "2023", "scale=M¤cy=AUD")
➤ Return on equity for 2024: =SF("AAPL", "ratios", "roe", "2024")
➤ EPS growth for 2024: =SF("AAPL", "growth", "epsgrowth", "2024")
➤ Earnings history and estimates: =SF("AAPL", "earnings")
➤ Revenue by product: =SF("AAPL", "revSegProduct")
➤ Revenue by geography: =SF("AAPL", "revSegGeo")
➤ Available company KPIs: =SF("AAPL", "kpiCatalog")
➤ Specific company KPIs: =SF("PLTR", "kpis", "commercialCustomerCount&commercialRevenue", "2020-2025")
➤ Dividend history: =SF_DIVIDEND("AAPL")
➤ Inst. and Insider Ownership: =SF("AAPL", "ownership") [historical ownership with SF_TIMESERIES()]
➤ Short Interest: =SF("AAPL", "shortInterest") [historical short interest with SF_TIMESERIES()]
Screening
➤ High-ROE mid caps on NASDAQ and NYSE: =SF_SCREEN("returnOnEquityTTM>0.2&marketCap<1000000000&marketCap>500000000&exchange=NASDAQ,NYSE", "symbol&exchange&marketCap&returnOnEquityTTM", "ob=returnOnEquityTTM&limit=100")
➤ Screen in AUD: =SF_SCREEN("marketCap>1000000000", "symbol&marketCap¤cy", "screenCurrency=AUD&ob=marketCap")
Brokerage
➤ Current holdings: =SF_BROKERAGE("MyAccount", "holdings", "symbol&name&price&marketValue")
➤ Account balances: =SF_BROKERAGE("MyAccount", "balances")
➤ Dividends received this year: =SF_BROKERAGE("MyAccount", "transactions", "all", "2026-01-01", TODAY(), "DIVIDEND")
Research
➤ Analyst price targets: =SF("AAPL", "priceTargets")
➤ Analyst rating history: =SF("AAPL", "ratings")
➤ Insider transactions: =SF("AAPL", "insiders")
➤ Institutional holders by shares held: =SF("AAPL", "instHolders", "all", "", "ob=shares")
➤ Historical sector PE: =SF("NASDAQ", "sectorPE")
➤ Latest news: =SF_NEWS("AAPL")
➤ Latest crypto news: =SF_NEWS("BTCUSD", "crypto")
ETFs
➤ ETF details: =SF("SPY", "etfInfo")
➤ ETF holdings: =SF("SPY", "etfHoldings")
➤ ETF sector exposure: =SF("SPY", "etfSectors")
Options
➤ Options chain: =SF_OPTIONS_PRO("AAPL", "calls&puts")
➤ Single contract: =SF_OPTIONS_PRO("AAPL261218C00135000")
Technical analysis
➤ Daily SMA 20 over 100 days: =SF_TECHNICAL("AAPL", "20sma&all", "daily", TODAY()-100, TODAY())
➤ 5-minute RSI 14 over 15 days: =SF_TECHNICAL("AAPL", "14rsi&all", "5min", TODAY()-15, TODAY())
Calendars
➤ Dividend calendar for Frankfurt, next 90 days: =SF_CALENDAR(".DE", "dividends", TODAY(), TODAY()+90, "all")
➤ Earnings calendar for India (NSE), next 30 days: =SF_CALENDAR(".NS", "earnings", TODAY(), TODAY()+30, "all")
💲 PRICING
Plans start from $10.95/month.
🔗 LINKS
📔 Documentation: https://www.sheetsfinance.com/docs
📔 Templates: https://www.sheetsfinance.com/docs/#/templates
🆘 Support: support@sheetsfinance.com
📄 Terms: https://www.sheetsfinance.com/policy/terms
🔒 Privacy: https://www.sheetsfinance.com/policy/privacy
🛠️ RELEASE NOTES
Full history in the Change Log: https://www.sheetsfinance.com/docs/change-log-9wti2
30/09/2026: NEW short interest function for current and historical. NEW ownership function for breakdown of institutional, insider and undisclosed company ownership. Sidebar layout and design fixes.
20/09/2026: NEW company KPI functions "kpis" and "kpiCatalog". NEW options currency=XXX and scale=K|M|B for converting and scaling function outputs.
09/09/2026: NEW "financials" calendar type for statement releases. Bug fixing nullish values in Excel.
02/09/2026: NEW screenCurrency=<code> added to SF_SCREEN() for currency-aware screening. SF usage tracking added to account page.
24/08/2026: NEW pre- and post-market historical data for supported intraday periods using the "extended" option in SF_TIMESERIES(). Function Generator updates and other optimisations.
17/08/2026: NEW stock split history in SF_TIMESERIES(), including split ratios, types, date ranges and Function Generator support.
23/07/2026: NEW brokerage connections: BMO InvestorLine, CIBC Investor's Edge, moomoo and TD Direct Investing. Improved historical EOD handling for market holidays and weekends.
23/06/2026: Fixes for Excel date handling and persistent sign-in.
20/05/2026: Updated setup and sign-in experience, brokerage sorting, options caching, eToro connections and futures data for Interactive Brokers.
28/04/2026: NEW onboarding and trial flow. Improved Google Sheets™ installation, email verification, password resets and brokerage connections.
09/04/2026: NEW RELEASE Professional options OPRA data package: chains, IV analytics, vol surfaces, 20+ years of history, including expired contracts. SF_OPTIONS_PRO() and SF_BROKERAGE() added to the Function Generator. Other optimisations.
03/04/2026: Real-time update speeds for Charles Schwab brokerage connections.
16/03/2026: Reduced latency on real-time exchange quotes, fixed symbol display for brokerage options transactions. Fixed technicals bug for ADX.
19/02/2026: Fix for calYear to index quarterlies by calendar year. Improved intraday time-series retrieval speeds. Fixed exchange display for brokerage options positions.
09/02/2026: NEW dailyAdj time-series for dividend-adjusted OHLCV.
01/02/2026: Fixed filter counter bug for screener, added decimal option to price change data, TTM ratios batch now 500 for Pro accounts.
18/01/2026: Excel add-in released.
11/01/2026: New brokerages added, bug fixing for brokerage connections.
14/11/2025: V4 RELEASE: new and improved financial statements, new IPO calendar, new sorting/filtering, lots of new data points added. See Change Log for full breakdown.
15/07/2025: New metrics added to companyInfo function. Batch processing improvements.
02/07/2025: 98 new metrics added to Stock Screener, new Stock Screener UI in-app. Bug fixing for long-period sparklines.
20/06/2025: Updated ratios function, new ratios, TTM ratios batching for 10-50 symbols, yield and frequency added to dividends.
29/05/2025: Bug fixing, exchange filter added to symbol search in-app, metric ordering for options, metric chaining for brokerage.
30/04/2025: NEW Brokerage Connections: connect your brokerage accounts to Google Sheets™.
22/04/2025: Fixed ADX bug for technicals, bug fixing for stock screener.
14/03/2025: NEW revenue segmentation by product or geography for US stocks using revSegProduct and revSegGeo, for both annual and quarterly statements.
12/02/2025: NEW batching of historical EOD data, metric chaining for historical function.
16/12/2024: Fixed RSI bug, new financial ratios added.
12/11/2024: Automatic handling of non-trading days for technicals, timezone bug fixes, options data optimisations.
08/10/2024: Template Library added to Google Sheets™. Automatic handling of bi-annual reporting companies.
20/09/2024: NEW SF_NEWS() for real-time news feeds, new daily historical shares outstanding and float, new score function for Altman Z-Score and Piotroski Score, added divYield to companyInfo, caching improvements.
27/08/2024: New template library, new blog, batch increase to 5,000, timezone bug fixes.
03/07/2024: Improvements to TTM data, new search terms for SF_CALENDAR, bug fixing.
27/06/2024: NEW SF_CALENDAR function for dividend, split, earnings and macroeconomic calendars. New Insider Trading and Insider Trading Statistics functions. New historical Sector and Industry PE ratios for all markets.
06/06/2024: New account management system and website, multiple connections, improved Symbol Search, speed improvements to caching and data retrieval.
12/04/2024: Added ISIN Mapper.
04/04/2024: New ESG and Owners Earnings functions, Analyst Ratings function updated, historical market cap output range increased to 5 years, new "Clear Cache" tool, major speed and memory optimisation improvements.
20/03/2024: Technical Analysis extended to 20+ years for daily and inter-day data. Bug fixing.
06/03/2024: New "mid" metric for options, updated ROIC calculation.
28/02/2024: Increased batch calls to 2,000 symbols at once, new quarterly estimates data, reversible year ordering for financials, ratios, growth and estimates, metric chaining for historical financials, new inter-day time-series periods, new "sum" option for historical TTM values, pre/post-market data now works in batch.
16/02/2024: Refresh for options data, new asset additions, bug fixing.
...
For older releases, see the full history in our Change Log: https://www.sheetsfinance.com/docs/change-log-9wti2
⚠️ DISCLAIMER
Data is provided "as is" for informational purposes only and is not trading or investment advice. SheetsFinance is not responsible for any trading losses incurred from using the data.
Google Sheets™ and Google Finance™ are trademarks of Google LLC.अतिरिक्त जानकारी
sell
कीमतइस ऐप्लिकेशन को बिना किसी शुल्क के आज़माने की सुविधा उपलब्ध है
code
डेवलपर
email
सहायता
lock
निजता नीति
description
सेवा की शर्तें
flag
शिकायत करेंआपत्तिजनक ऐप्लिकेशन की शिकायत करें




खोजें
खोज हटाएं
खोज बंद करें
Google ऐप
मुख्य मेन्यू