
Google Workspace Marketplace


Sortia: Monte Carlo Simulation, Statistics & Risk
Monte Carlo simulation, statistics, forecasting, risk analysis: 50+ tools, 40+ free, in Google Sheets™.
Listing updated:September 27, 2026
Works with:
No reviews
60



Overview
You have to give a number on Thursday. Give a range instead.

Sortia is a Google Sheets™ add-on for Monte Carlo simulation, statistical analysis, forecasting, risk analysis and optimization under constraints. It puts more than 50 tools for statistics, data analysis, what-if analysis and everyday decisions in the Google Sheets™ file you already have open, then reads every result back in a sentence anyone in the room can follow.

Five things worth knowing before anything else:

• Maintained and tested: more than 3,000 automated tests run on every commit, against published textbook values and independent reference implementations. The method is public at sortia.io/validation. • Fast, with honest ceilings: the Monte Carlo engine runs in your browser, 10,000 trials by default and up to 100,000,000 in one go. Where an engine has a ceiling it is the same on free and on Pro, measured and published at sortia.io/performance. • Two permissions, and that is the whole list: the spreadsheet you open Sortia in, and the sidebar it draws. No Drive access, ever. • Results land in your sheet: every run writes its numbers into cells you can chart, audit and keep, not into a picture you cannot touch. • A plain price: more than 40 of the tools are free, with no run counter, and the free plan is not a timed trial. Pro is $199/yr or $29/mo.

WHAT IS IN IT

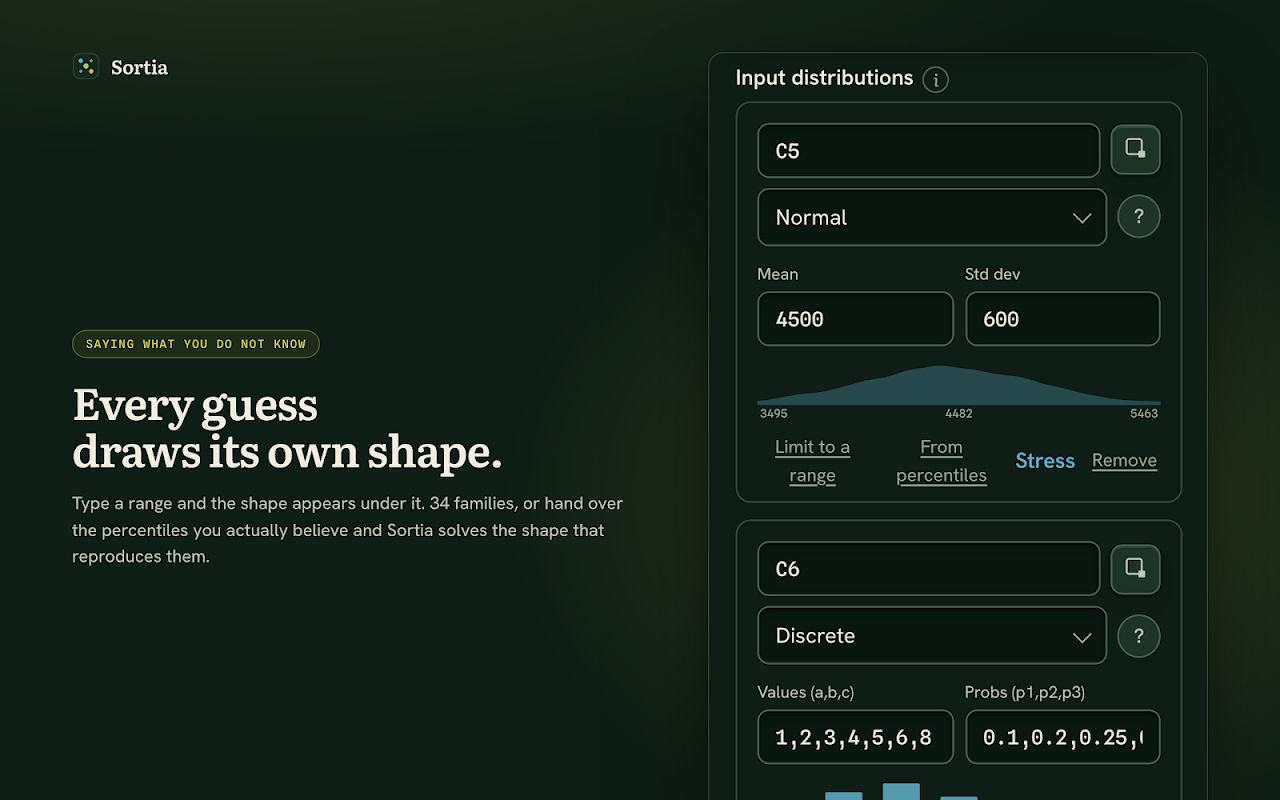
Monte Carlo risk analysis. Put a range on the inputs you were guessing at, drawn from 34 distribution families, with Latin Hypercube sampling and correlations between inputs, typed pair by pair or read from a correlation matrix on your sheet. On any continuous shape you can skip the parameters and type the P10, P50 and P90 you actually believe, and Sortia solves the parameters that reproduce those percentiles. You can stress one input, sampling only the slice of its distribution that worries you, and the report says the input was stressed. One of the families is a compound events-times-cost shape, for claims, outages and warranty hits. While a run is going the panel says whether the answer has settled, it will stop early once more trials would not change the decision if you ask it to, and a seeded run stops at the same trial on every machine. Percentiles, a histogram and a tornado chart for sensitivity analysis land in the sidebar the moment the run finishes, each with a plain-language reading, and then the numbers are written to your sheet. The report adds scenario analysis inside the tails: a table of what the inputs actually looked like in the trials that landed in the worst and the best tenth, which is the question a planning meeting asks about a bad quarter.

Statistics and machine learning, more than 35 Data Analysis tools, every one of them free. Descriptive statistics, t-tests, z and F tests, ANOVA, chi-square, Mann-Whitney, Wilcoxon, Kruskal-Wallis, linear regression and logistic regression with odds ratios, correlation and covariance, rank and percentile, histograms, outlier detection, A/B testing with sample size planning, k-means clustering, market basket analysis, random numbers and sampling, and fuzzy matching that lines up "Globex Inc." with "Globex Incorporated". If your statistical analysis used to run through the Analysis ToolPak in desktop Excel, every tool in that pack has a counterpart here: ANOVA, correlation, covariance, descriptive statistics, exponential smoothing, F-tests, Fourier analysis, histograms, moving averages, random number generation, rank and percentile, regression, sampling, t-tests and z-tests, and each one writes its result into your sheet.

Distribution fitting that grades every candidate by Kolmogorov-Smirnov, Anderson-Darling, AIC, BIC and chi-square, with approximate p-values, fits every column of a range at once, and hands the winning parameters straight into a Risk Analysis input.

The machine learning reports what it is honestly worth. Logistic regression and a classification tree keep a quarter of your rows back, print the held-out score and the AUC next to the training figure, say whether the tree beat simply guessing the commonest answer, and show the rules they learned. A gain table tells you how much of what you are looking for sits in the top slice, for when you can only act on part of a list. A neural network predicts numbers or labels and reports its held-out test score too.

Forecasting. Moving average, exponential smoothing, Holt-Winters seasonal forecasts, ETS and ARIMA, autocorrelation and Fourier analysis. A Holt-Winters or ETS forecast can hand straight into a simulation over the forecast values, which is forecasting and risk analysis on the same tab.

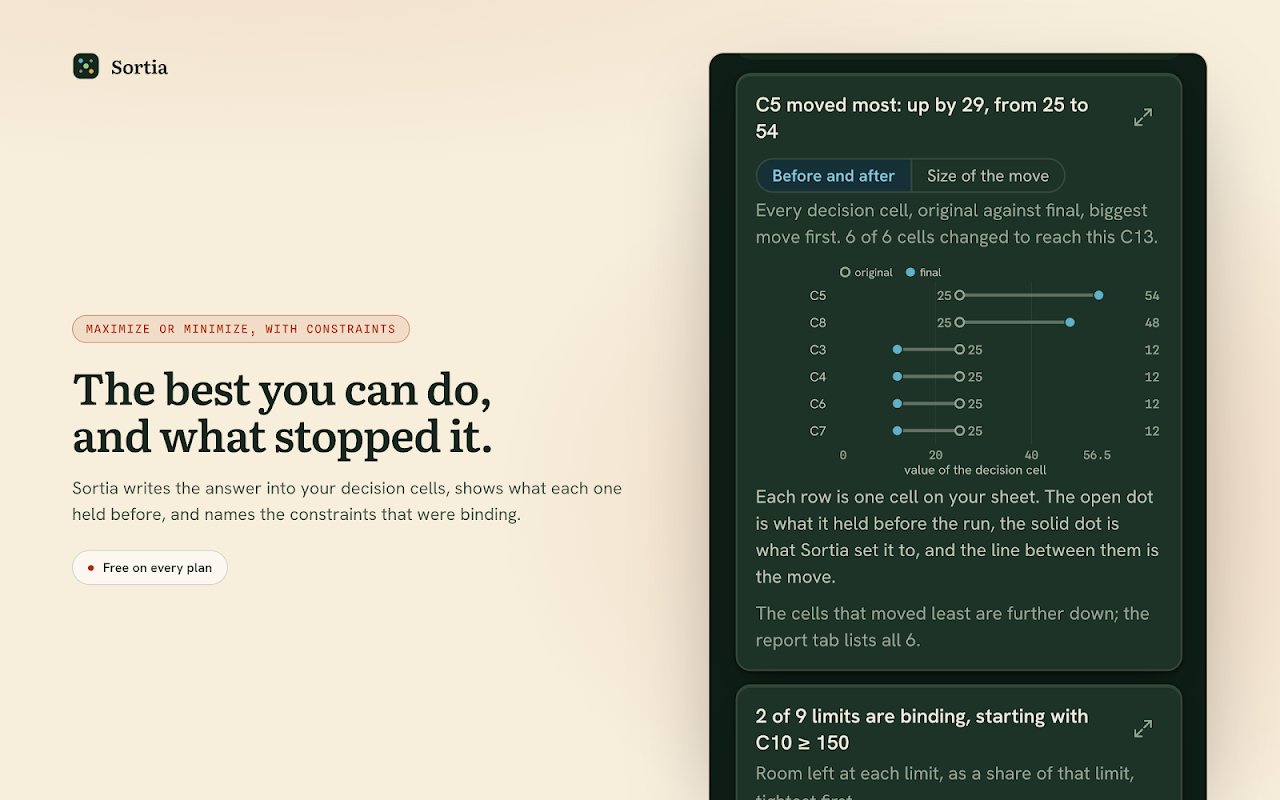
Optimization under constraints. A linear optimizer that lives in your sheet: Simplex linear programming with integer and binary variables, plus nonlinear and evolutionary engines. The engine class is what a spreadsheet veteran would call a linear solver, and it answers to that job description: state an objective, add constraints, get the optimum. The answer is stated in the panel, and the report names the limits actually binding it, which is the part you defend in the meeting.

Decisions and projects, which are the Pro side of the line. Build a decision tree and Sortia rolls it back to the expected-value policy with a risk profile, then runs sensitivity sweeps on the tree that price what perfect or imperfect research would be worth before you pay for it. Weighted scoring, multi-criteria analysis and 2x2 payoff matrices. Critical path, schedule risk with P80 dates, critical chain with buffers, resource loading, a risk register, earned value and S-curve forecasts.

What-if analysis on the model you have already built: named scenarios you switch between for scenario planning, Goal Seek, and one and two variable Data Tables.

More than 350 templates. Each one is a question somebody asked first, like will the contingency last, or what is the runway, and one click writes a working model with real numbers into your sheet. From the gallery to a real answer is three clicks, counted on the shipped product under a convention strict enough to count clicking into a field, and published at sortia.io/performance.

EVERY RESULT EXPLAINS ITSELF

A run ends with a card called What this means: the probability that matters, the biggest driver, and what to tighten first. On the free plan that sentence is written by the add-on itself, in your browser, from the figures the engine just computed. Nothing about your model is sent anywhere to produce it. Pro adds an AI reading of the same result, written by Google Gemini™ from the shape of the result alone, with a See what was sent panel showing the exact payload. AI explanations are a Pro feature; the free plan never sends anything to a model.

The engines themselves are not AI. They are deterministic: same model, same seed, same numbers, on any machine, to the last digit. That is what makes an answer you can hand to somebody else, and every report carries its own provenance line: the date, the model tab, the engine, the trials and the seed, and a note when a run stopped early. The tab you hand over can answer what produced it.

YOU ARE NEVER ASKED TO ALREADY KNOW

Answer two questions and Sortia names the tool, the distribution or the solving method to use, tells you what that choice cannot tell you, and points at the alternative if you picked wrong. The tool guide, the distribution guide and the solving-method guide all open inside the panel, and all three are free.

WHAT IS FREE

More than 40 of the tools. Every one of the statistics, forecasting and machine learning tools, the clustering, the classification tree and the neural network among them. A few carry a ceiling of their own, the same on free and on Pro: Fourier Analysis reads a power-of-2 count of points up to 4,096, k-means fits at most 50 clusters, batch distribution fitting takes at most 24 columns, and any one selection is read up to 500,000 cells. All three optimization engines: in the browser, Simplex LP takes up to 2,000 decision cells instantly and continuous models up to 10,000 with a progress bar (integer models stop at 2,000), Evolutionary 100 and Nonlinear 60, and a model that has to be solved through the sheet instead takes 200, 15 and 10. What-if analysis, Goal Seek and Data Tables. No run counter, and no size ceiling that a licence lifts: where an engine has one it is the same on both plans, and every one of them is measured and published at sortia.io/performance. Over 180 of the templates run start to finish without paying. Plus five full-quality runs of the Pro engines, five in total rather than five of each, so you see a real answer before you decide anything.

Free gives you the tools. Pro reads the answer with you.

PRO, $199/yr or $29/mo

Unlimited runs of the five Pro engines: Monte Carlo risk simulation, decision trees and the other Decisions tools, the Project tools, Critical Chain, and optimization under uncertainty. Plus the AI readings above, and no attribution line on your report sheets. There is a $9 day pass good for seven days, a $99/yr academic licence, and team, school and company licences at sortia.io/teams.

PRIVATE BY DESIGN

Two permissions, and this is the whole list: the spreadsheet you open Sortia in, and the sidebar it draws. No Drive access, ever. The Monte Carlo engine runs in your browser and the statistics tools run in Google Apps Script™, attached to the file you have open. Either way your spreadsheet data never leaves your sheet. An AI reading sends only the shape of a result, meaning ratios, correlations, counts and cell references, and never cell values, column headers, row labels, sheet names or formulas. Administrators can switch it off for a whole domain, and organisation-wide site and school licences ship with it off. Sortia also counts anonymous usage, on both plans: a token that is re-salted every day and the name of the tool you opened, so we can tell how many people used it and never who. Full policy at sortia.io/privacy, which lists every field that leaves.

CHECKABLE, NOT JUST CONFIDENT

More than 3,000 automated tests run on every commit, checking the engines against published textbook values, published critical values and independent reference implementations that derive the answer a different way. The method is written out at sortia.io/validation, and every engine ceiling in this listing is measured and published at sortia.io/performance.

Google Sheets™ is a trademark of Google LLC. So are Google Apps Script™ and Google Gemini™. Sortia is not affiliated with or endorsed by Google.
Additional information
sell
PricingFree of charge with paid features
code
Developer
email
Support
lock
Privacy policy
description
Terms of service
flag
ReportFlag as inappropriate




Search
Clear search
Close search
Google apps
Main menu