
Vizzlo – Charts & Business Graphics
Easily create engaging charts and graphics, present, and impress!
应用详情更新日期:2024年5月30日
适用于:
17万+


概览
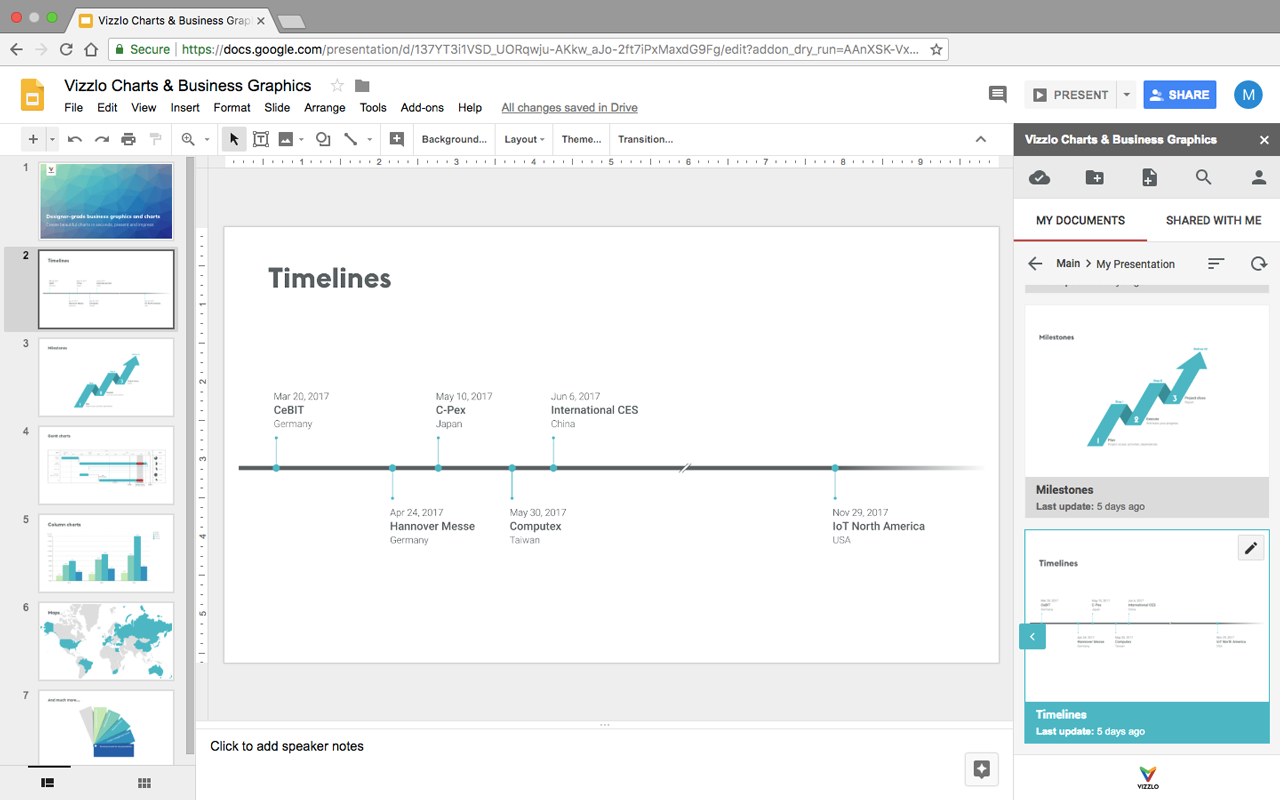
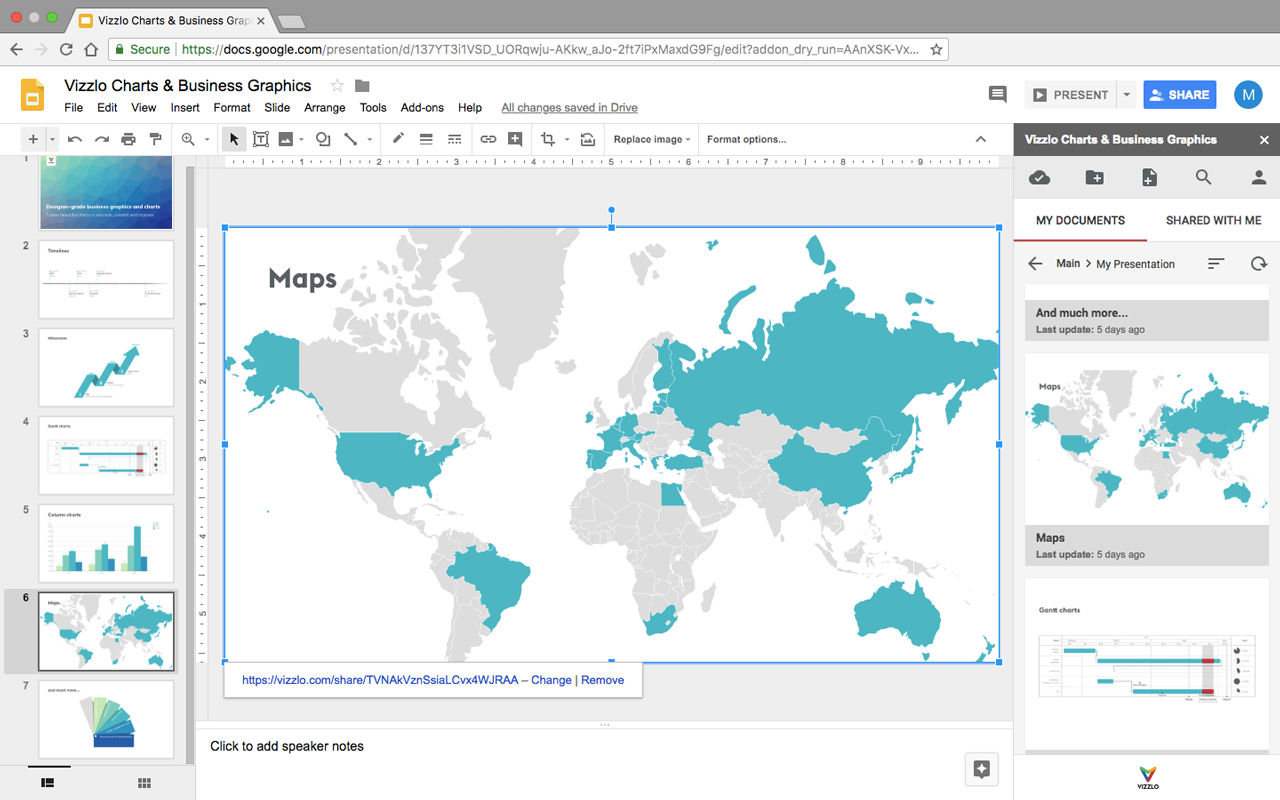
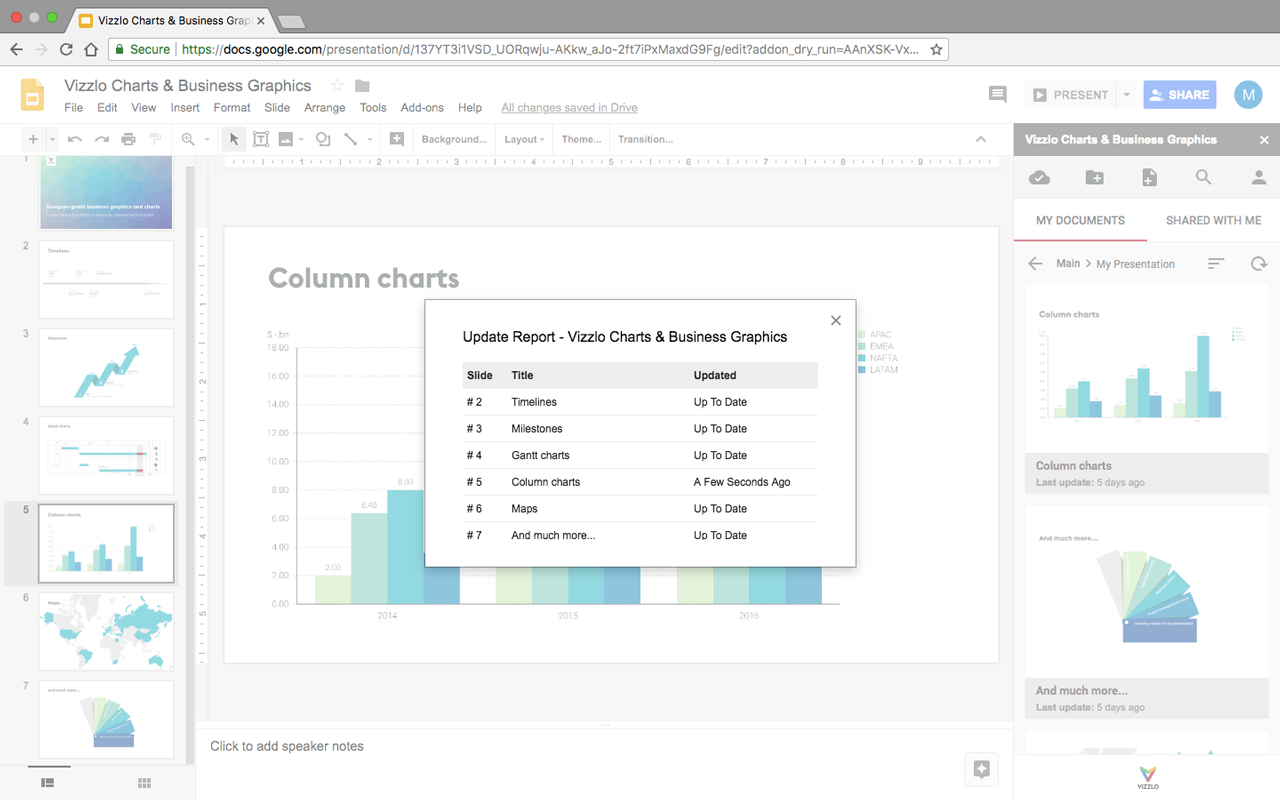
Vizzlo is your go-to online tool for creating high-quality visual aids effortlessly. Often touted as the "think-cell for Google Slides," Vizzlo offers over 100 chart types, from timelines and Gantt charts to data-driven graphs, equipping project managers, marketers, consultants, teachers, and students with all the essential visual frameworks needed for professional presentations.

Key Features:

- Extensive Chart Library: Access a wide variety of charts and diagrams to fit any presentation need.

- Customizable Designs: Easily match your charts with your corporate design, including logos, colors, and fonts.

- Google Slides™ Integration: Insert and update visuals directly within Google Slides™. Seamlessly create and edit graphics through Vizzlo’s browser-based interface, compatible with any OS or browser.

- Efficient Collaboration: Automatically syncs updates with shared teammates, ensuring everyone has the latest version of the visuals in their presentations.

- Remote Data Connectivity: Connect Vizzlo charts to remote data sources, ensuring your visuals are always up-to-date with the latest information.

- No Design Skills Needed: Focus on your data and ideas—Vizzlo makes your presentations visually striking and professional with minimal effort.

Enhance Your Presentations:

Save time and convey your message effectively with Vizzlo’s intuitive tools. Whether you're preparing a business report, a class project, or a marketing proposal, Vizzlo helps you create designer-grade visuals without any design expertise.

Check out our website for Teams and Enterprise plans!
其他信息


搜索
清除搜索内容
关闭搜索框
Google 应用
主菜单