
Vizzlo – Charts & Business Graphics
Easily create engaging charts and graphics, present, and impress!
商店資訊更新日期:2024年4月26日
適用裝置:
17萬+


總覽
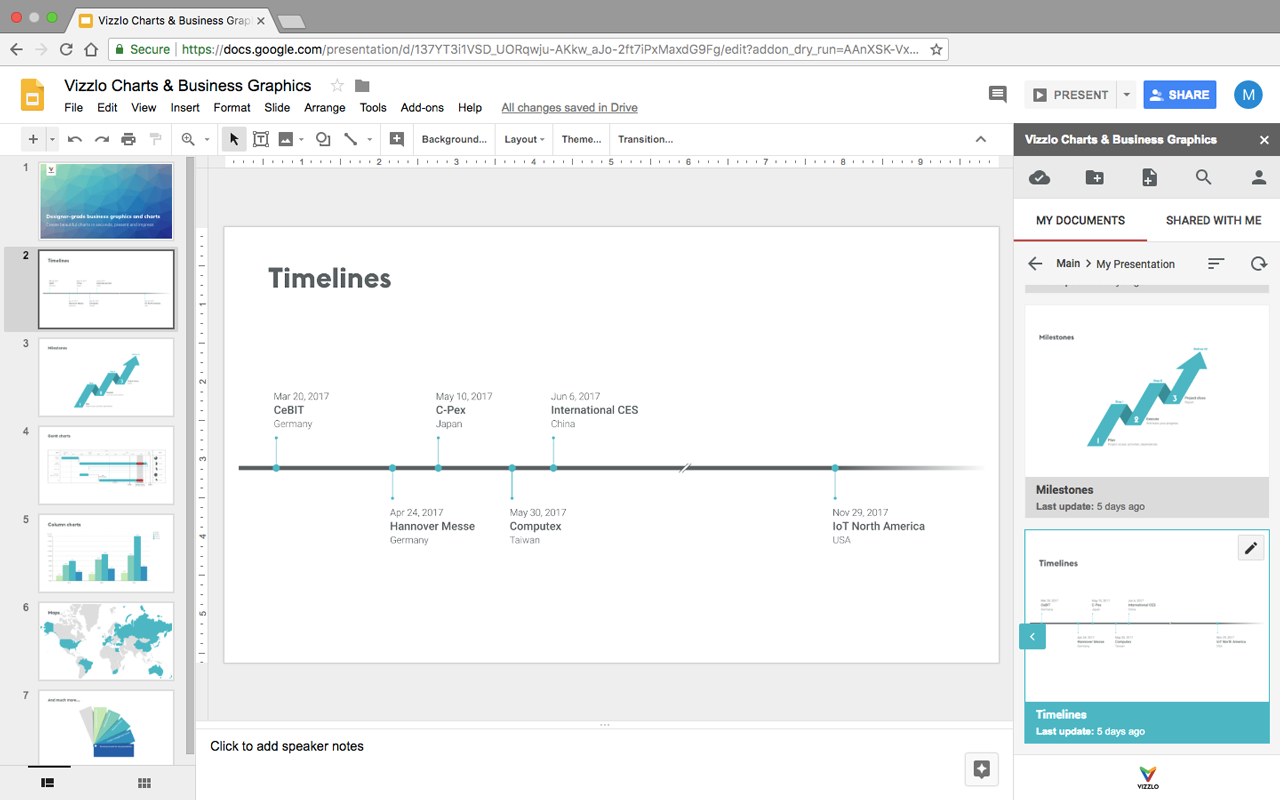
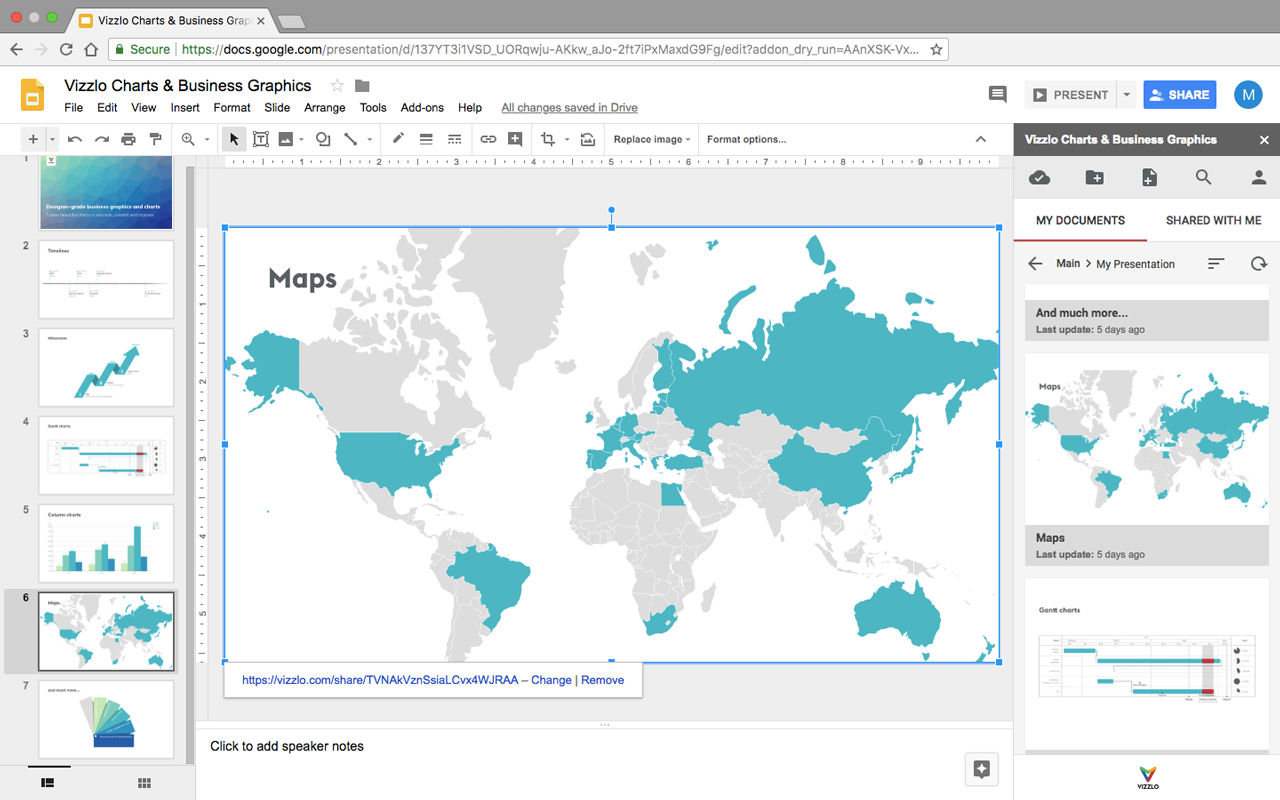
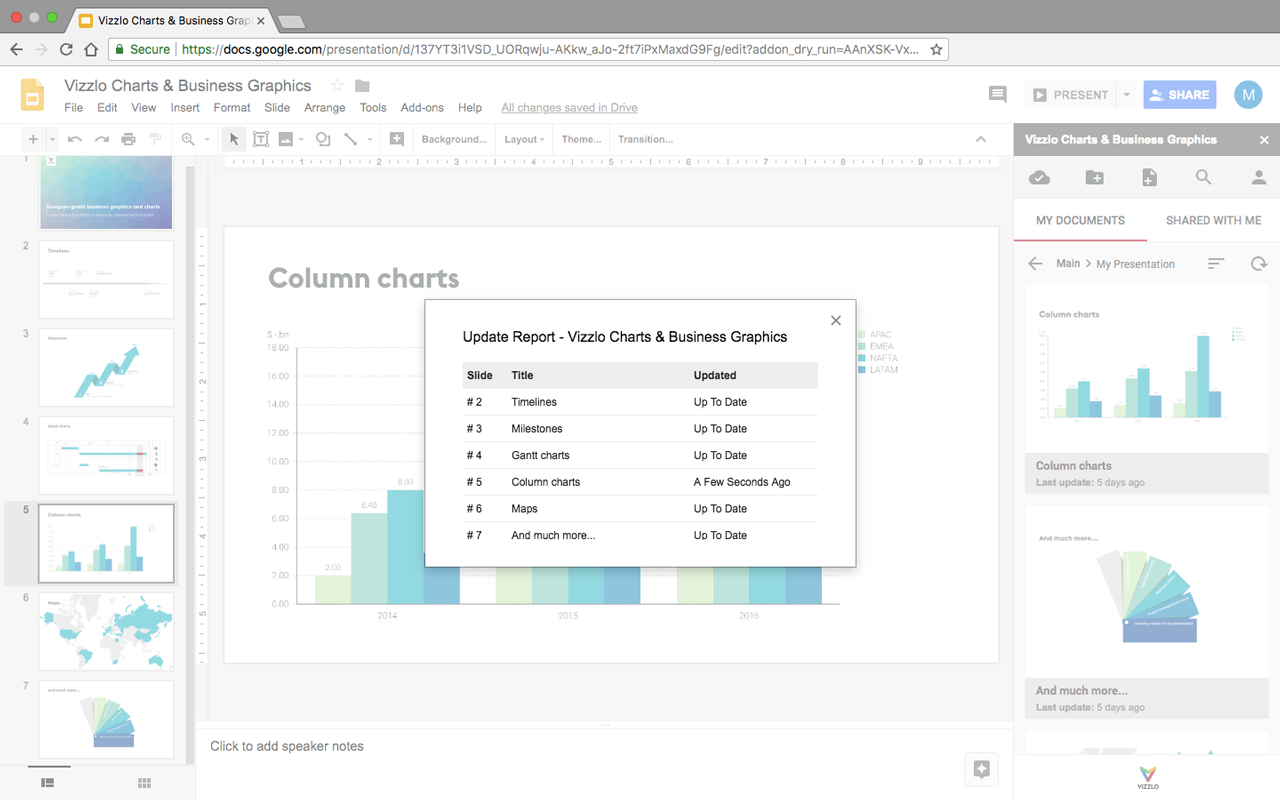
Vizzlo is a super friendly and versatile online tool to create designer-grade visual aids for presentations. Choose among 100+ different chart types, from timelines and Gantt charts to precise data-driven graphs. Vizzlo's portfolio offers all the essential graphs, diagrams, and concept-driven visual frameworks to help project managers, marketing professionals, consultants, teachers, and even students convey their messages professionally. Easy to customize, you can make any chart match your corporate design (logo, colors, and fonts) or the style of your slide deck.

Vizzlo's add-on for Google Slides™️ enables you to insert and update your visuals from within the Google Slides™️ environment. It's also very easy to edit and create new graphics using the connected browser-based Vizzlo interface, which is compatible with any operating system or browser. The add-on's synchronization with your Vizzlo account integrates the "create-insert" workflow seamlessly, maximizing your productivity.

This also results in enhanced collaboration and teamwork: if you modify a chart that has been shared with teammates and inserted into their presentations, they will get its latest version automatically the next time they update their Vizzlo documents in their slide decks.

Save time preparing visual aids for your presentations, insert them directly into your Google Slides, and convey your message effectively—you don't need any design skills, only your data, and ideas.
其他資訊


搜尋
清除搜尋內容
關閉搜尋
Google 應用程式
主選單