Turn your data into action: 6 mini apps you can create with Sheets canvas

Eric Birnbaum
Director, Product Management, Google Sheets
Try Google Workspace at No Cost
Get a business email, all the storage you need, video conferencing, and more.
SIGN UPSpreadsheets are unmatched for tracking and organizing massive amounts of data, but a traditional row-and-column grid isn’t always the most intuitive layout for sharing data trends and insights, communicating project status, or reviewing priorities as a team. Historically, teams have had to build these visualizations manually or adopt costly third-party tools that fragment their data.
We are bridging that gap with Sheets canvas, a new AI-powered feature that uses our new Gemini 3.8 Flash model to transform your spreadsheet data into custom, interactive mini apps. Instead of coding a custom visualization from scratch, you can simply describe what you need in natural language. Any changes you make in the visual layout, like changing a task status or adding a milestone, instantly update the underlying spreadsheet data. Because everything lives within your sheet, these apps are simple to share using standard file permissions, giving your team intuitive, flexible views while keeping your data clean and protected.
Sheets canvas helps our teams turn complex data into interactive visualizations with a simple prompt, instead of wrestling with pivot tables and slicers. This type of zero-code visualization can unlock meaningful productivity across the organization.
Eduardo Salas, CIO at Whirlpool Corporation
The possibilities are limitless, but here are six ways to get started with Sheets canvas:
1. Turn project trackers into dynamic Kanban boards
Tracking detailed tasks in a spreadsheet is essential, but project management moves faster when progress is visual. Ask Gemini to turn your task tracker into an interactive Kanban board organized by custom status categories, like Not Started, In Progress, Need Input, and Done.
When you or your teammates drag and drop task cards across columns or reassign owners on the board, the underlying spreadsheet cells update automatically in real time, keeping everyone synchronized without manual data entry.
Try the example prompt included in the video description with your own task list to build a dynamic Kanban board, like this:

2. Consolidate dense metrics into executive-ready dashboards
Analyzing product feedback or campaign performance across thousands of rows can make it difficult to see the bigger picture. Use Sheets canvas to turn your raw data points into an executive-ready dashboard with real-time scorecards, trend lines, and filters.
Stakeholders can easily filter by customer segment, drill into specific sentiment scores, or highlight emerging themes to self-serve the exact insights they need. If the source data changes, the Sheets canvas syncs in real time, giving viewers the latest insights and metrics.
Try the example prompt in the video description, with your reporting data to create your own executive-ready dashboard, like this:

3. Transform financial forecasts into interactive scenario models
Modeling financial forecasts requires understanding how shifting conditions impact your bottom line, but building sensitivity analyses in traditional spreadsheets can be cumbersome. Sheets canvas can help turn your forecast into an interactive visual model, making it easy to adjust key assumptions and instantly see their impact.
Share the dynamic canvas with your team to test alternative scenarios together without altering or breaking underlying formulas.
Try the example prompt in the video description with your financial forecast to build an interactive scenario model, like this:

4. Map event details onto visual schedules
Planning a multi-track conference or product launch requires managing dozens of moving parts. While spreadsheets capture every line item, seeing the chronological sequence, gaps, and overlaps is critical to execution. Use Sheets canvas to map your event data into an interactive visual timeline and run-of-show calendar.
You can easily drag cards to adjust session timings, update room logistics inline, or insert new agenda items directly onto the schedule. All changes will reflect in the central schedule sheet, too.
Try the example prompt in the video description with your agenda items to generate a visual event schedule, like this:

5. Organize and prioritize tasks on a visual planning board
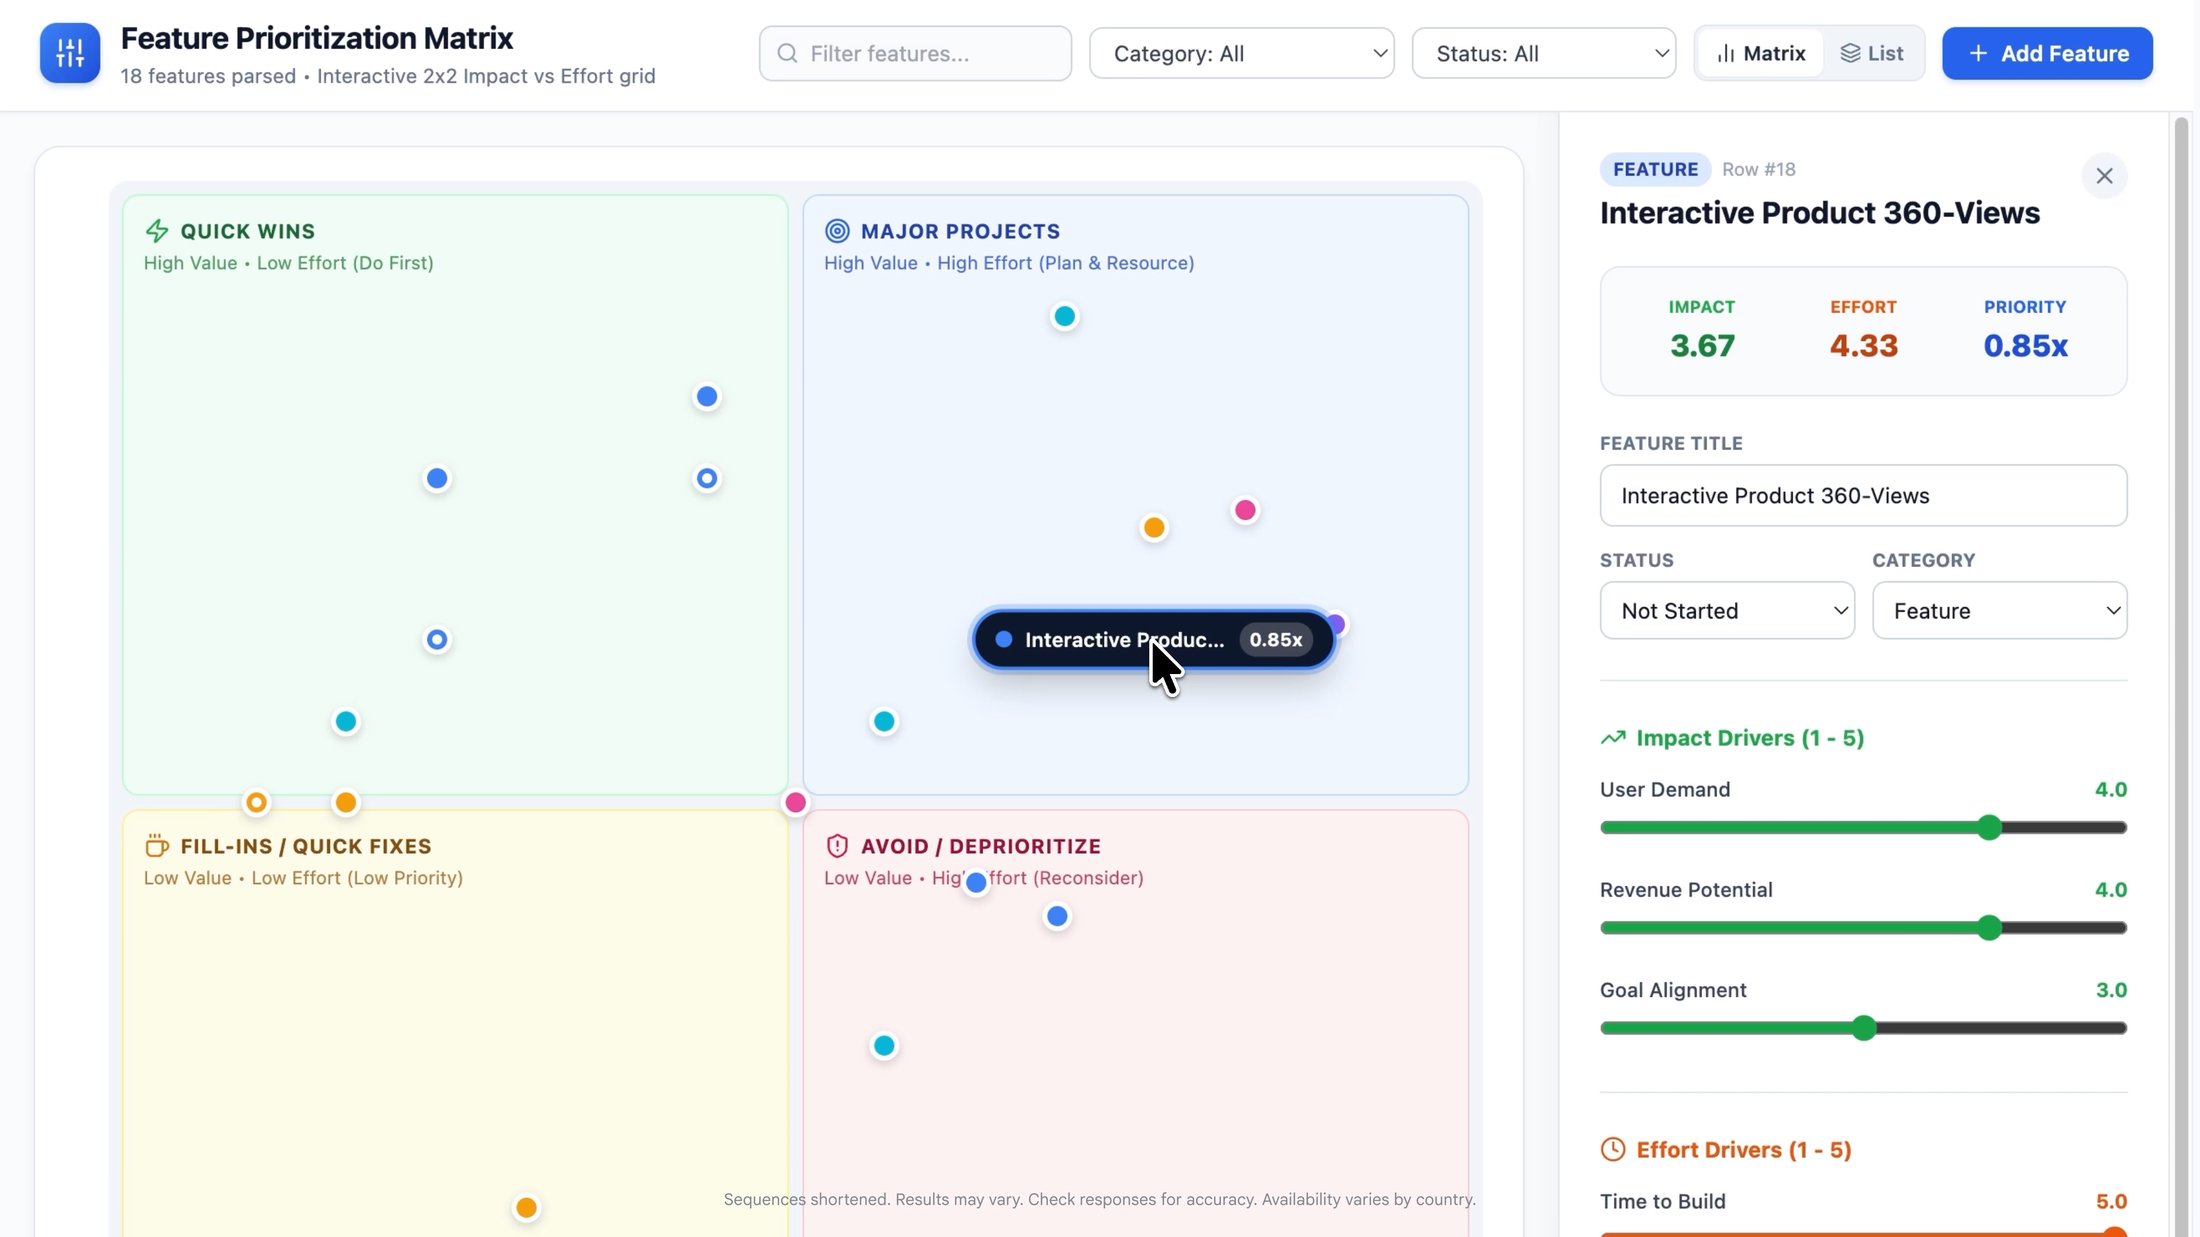
When managing a growing backlog of high-priority tasks or feature requests, deciding what to tackle next can quickly become overwhelming. Use Sheets canvas to plot your raw backlog items onto a 2x2 planning matrix that evaluates priority against required development effort.
Your team can collaboratively adjust effort or impact scores directly on the grid, watching features shift across quadrants to help you pinpoint quick, high-impact wins and get clarity on roadmap priorities.
Try the example prompt in the video description with your product backlog to create a 2x2 priority matrix, like this:
6. Turn raw ideas into next steps with a collaborative board
Group brainstorming is great for generating ideas, but sessions often end with an unorganized list of thoughts or action items that someone has to manually sort and assign. Sheets canvas can help structure results from your brainstorm into a collaborative digital workshop board with categorized cards and voting columns.
Team members can upvote concepts, group related themes, and assign action owners directly on the board, keeping the high-energy, collaborative feel of a live workshop. Plus, all ideas and details sync directly back to your underlying spreadsheet.
Try the example prompt in the video description with your brainstorm list to build an interactive workshop board, like this:

Ready to build?
These six examples just scratch the surface of what is possible at work or for a personal project. If you can describe it, canvas can bring it to life.
Bringing capabilities like Sheets canvas directly into daily workflows allows our teams to analyze data, streamline processes, and innovate faster — empowering every employee to solve problems and drive productivity securely at scale.
Jesse Liamzon, Head of AI Forward Deployed Engineering at Globe Telecom
Sheets canvas is now available to Google Workspace customers on Business and Enterprise Standard and Plus plans, Google AI Pro and Ultra personal plans, or the Google AI Pro for Education plan.
To start transforming your data, open any Google Sheet, navigate to Insert > Create a canvas, and ask Gemini to design your first custom mini app!